Feeder Downtime Root Cause Analysis: A Systematic Approach

Why feeder downtime keeps coming back
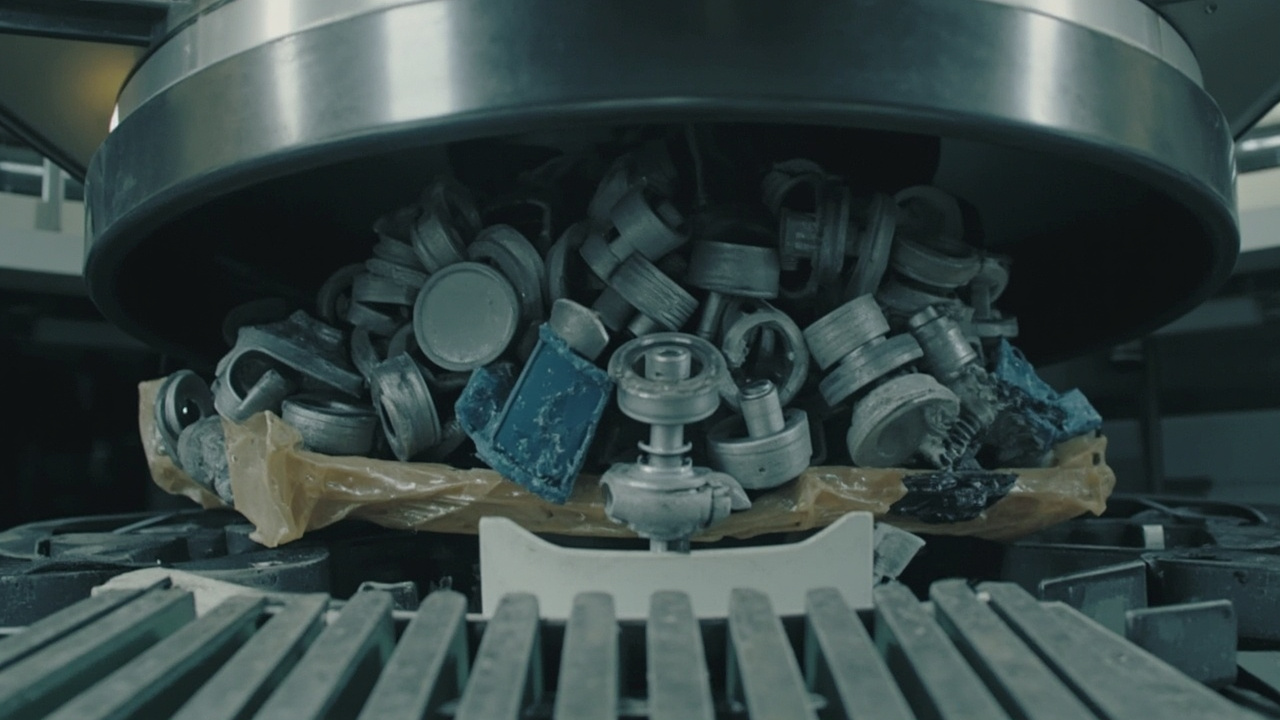
When a bowl feeder stops, the typical response is to clear the jam, restart the feeder, and get the line running again. The downtime event gets logged under a generic category like "feeder jam" and the root cause is never investigated. Two days later, the same feeder stops again. The same jam. The same fix. This cycle repeats because the symptom was treated, not the cause. The jam is not the problem — it is the consequence of a problem that remains unaddressed.
Root cause analysis (RCA) for feeder downtime is not complicated, but it requires discipline. It requires stopping long enough to ask why the jam occurred, collecting data instead of relying on memory, and following a structured method instead of jumping to the first plausible explanation. The payoff is substantial: most feeder downtime events share a small number of root causes. Fix those root causes once, and the recurring stops disappear permanently.
This guide presents a systematic approach to feeder downtime RCA, covering the 5 Whys method adapted for feeding systems, a categorization framework for downtime events, Pareto analysis to prioritize corrective actions, data collection methods, and a roadmap for sustained downtime reduction. For a broader view of how feeder performance affects line output, see our guide on how to improve OEE by fixing hidden losses in parts feeding systems.
Categorizing feeder downtime: five distinct failure modes
Not all feeder downtime is the same. Lumping every stoppage under "feeder problem" makes pattern recognition impossible. The first step in effective RCA is categorizing each downtime event accurately. Based on field data from hundreds of feeding systems, five categories cover more than 95% of all feeder stoppages.
Jam: A physical obstruction prevents part movement. Parts bridge across the track, wedge in a selector, or pile up at a transition point. The feeder continues to vibrate but parts stop advancing. Jams are the most visible downtime type and the most frequently logged, but they are often symptoms of deeper issues rather than root causes.
Starvation: The bowl runs out of parts, or parts are not reaching the discharge fast enough to keep up with downstream demand. Starvation can be caused by insufficient hopper refill, a feed rate that is too slow for the cycle time, or a recirculation loop that traps parts in the bowl center instead of moving them onto the track.
Misfeed: Parts arrive at the discharge in the wrong orientation, at the wrong spacing, or with the wrong presentation. The feeder is running and parts are moving, but downstream equipment cannot use them. Misfeeds are particularly costly because they often do not trigger an immediate stop — instead, they cause quality defects or robot pick failures that are detected later in the process.
Mechanical failure: A physical component breaks or degrades to the point where the feeder cannot operate. Spring fracture, coil burnout, bearing seizure, and tooling breakage are common examples. Mechanical failures are typically the least frequent but the longest-duration downtime events.
Control fault: The controller enters a fault state, the power supply is interrupted, a sensor fails, or a communication error occurs between the feeder and the line PLC. Control faults are often intermittent and difficult to reproduce, making them frustrating to diagnose without proper data logging.
| Downtime category | Typical frequency | Average duration | Common root causes |
|---|---|---|---|
| Jam | Highest frequency | 2-15 minutes | Track wear, part variation, tooling shift, debris |
| Starvation | Moderate frequency | 5-30 minutes | Hopper sizing, refill discipline, feed rate mismatch |
| Misfeed | Moderate frequency | Variable (often undetected) | Tooling wear, amplitude drift, part lot variation |
| Mechanical failure | Low frequency | 1-8 hours | Spring fatigue, coil overheating, bearing wear |
| Control fault | Low-moderate frequency | 10-60 minutes | Loose connections, sensor failure, PLC communication |
- Accurate categorization is the foundation of effective RCA — never log a stoppage as just "feeder problem"
- Jams are symptoms, not root causes — always ask what caused the jam
- Misfeeds are the most dangerous category because they often go undetected until quality escapes occur
The 5 Whys method adapted for feeder downtime
The 5 Whys technique is a straightforward RCA method: ask "why" repeatedly until you reach a root cause that can be addressed with a permanent corrective action. The method works well for feeder downtime because most stoppages have a chain of causation that is 3-5 levels deep. Stopping at the first or second "why" leads to superficial fixes that allow the problem to recur.
Example: Recurring jam at a selector blade
- Why did the feeder stop? Parts jammed at the orientation selector.
- Why did parts jam at the selector? Parts in the wrong orientation were not rejected and wedged against the selector edge.
- Why were wrong-orientation parts not rejected? The upstream air jet that should have blown them off the track was not firing.
- Why was the air jet not firing? The solenoid valve was not receiving a signal from the controller.
- Why was the solenoid not receiving a signal? The sensor that triggers the air jet had shifted out of position due to a loose mounting bracket.
The root cause is a loose sensor bracket. The corrective action is to reposition the sensor, tighten the bracket with thread-locking compound, and add a bracket inspection to the weekly maintenance checklist. Without the 5 Whys, the jam would have been cleared and the feeder restarted — and the same jam would recur within days.
Rules for effective 5 Whys analysis:
- Perform the analysis immediately after the event, while evidence is still available
- Go to the machine — do not analyze from a conference room
- Involve the operator who was present when the stoppage occurred
- Stop when you reach a cause that you can act on with a specific, permanent corrective action
- Do not stop at "human error" — ask why the system allowed the error to cause a stoppage
- Document each step and the evidence that supports it
Pareto analysis: finding the vital few causes
After collecting categorized downtime data for 4-8 weeks, a Pareto analysis reveals which root causes account for the majority of lost production time. The Pareto principle (80/20 rule) applies strongly to feeder downtime: typically, 3-5 root causes account for 80% of total downtime hours.
Building the Pareto chart: List each root cause identified through 5 Whys analysis, count the number of occurrences, and calculate the total downtime hours attributable to each cause. Sort by total downtime in descending order. Calculate the cumulative percentage. The causes that fall within the first 80% of cumulative downtime are your vital few — these are the ones worth fixing first.
Common vital few causes in feeder operations:
- Part variation between lots — dimensional or weight variation causes tooling that was set for one lot to fail on the next
- Inconsistent hopper refill — operators refill at irregular intervals, causing alternating starvation and overfill conditions
- Spring fatigue — springs that should be replaced on a schedule are run to failure, causing gradual feed rate decline and eventual stoppage
- Loose tooling fasteners — vibration loosens selector blades and baffles over time, shifting orientation geometry
- Coil air gap drift — the gap between coil and armature gradually increases due to spring settling, reducing drive efficiency
Addressing these five causes alone can reduce feeder downtime by 60-80% in most operations. The corrective actions are not expensive: a part qualification procedure, a hopper refill schedule, a spring replacement calendar, thread-locking compound on tooling fasteners, and a quarterly air gap check. The challenge is not technical complexity — it is execution discipline.
- Collect at least 4 weeks of categorized data before attempting Pareto analysis — shorter periods produce misleading results
- Sort by total downtime hours, not occurrence count — a rare mechanical failure that causes 4 hours of downtime is more important than a daily 2-minute jam
- Focus corrective actions on the vital few — fixing the top 3-5 causes yields 80% of the improvement
Data collection methods that actually work
Root cause analysis is only as good as the data it is based on. Most feeder downtime data is poor: events are logged after the fact, categories are generic, and critical details like part lot number, bowl fill level, and operating conditions are not recorded. Better data collection does not require expensive systems — it requires a simple form and the discipline to fill it out at the time of the event.
Paper-based event log: The simplest effective method is a clipboard mounted at each feeder station with a pre-printed form. The form should capture: date and time, downtime category (jam / starvation / misfeed / mechanical / control), duration, operator name, what was found when the stoppage was investigated, what action was taken, and whether the same problem has occurred before. This takes 2-3 minutes per event and produces data that is far more useful than a generic entry in a CMMS.
Controller data logging: Modern digital feeder controllers can log fault codes, operating hours, amplitude history, and current draw. Download this data weekly and correlate it with the operator event logs. Controller data provides the "what" and "when" — the operator log provides the "why" and "how." Together, they give a complete picture.
PLC integration: If the feeder is integrated with a line PLC, configure the PLC to log feeder status (running / stopped / faulted), cycle count, and fault codes with timestamps. This automates the data collection and eliminates the problem of operators not logging brief stoppages. Even 30-second micro-stops add up over a shift — a feeder that stops for 30 seconds every 10 minutes loses 5% of its available production time.
Photographic evidence: When a jam or misfeed occurs, photograph the condition before clearing it. A photo of parts wedged in a selector tells the engineer more than a written description. Use a phone camera — image quality is not critical, but capturing the condition before it is disturbed is.
Building a downtime reduction roadmap
Once you have categorized data, Pareto analysis, and root cause understanding, you can build a structured roadmap for sustained downtime reduction. The roadmap should be organized in phases, with measurable targets and timelines.
Phase 1 — Quick wins (Weeks 1-4): Address the top 2-3 root causes that have straightforward corrective actions. Typical quick wins include: establishing a hopper refill schedule, applying thread-locking compound to all tooling fasteners, and setting up a spring replacement calendar. These actions require minimal investment and typically reduce downtime by 30-40%.
Phase 2 — Process improvements (Weeks 5-12): Tackle root causes that require process changes or modest capital investment. Examples include: implementing a part lot qualification procedure, adding level sensors to automate hopper refill, upgrading to a digital controller with fault logging, and establishing a vibration monitoring program as described in our bowl feeder orientation problems guide. Phase 2 typically achieves an additional 20-30% reduction.
Phase 3 — Systematic reliability (Ongoing): Implement the organizational practices that sustain the gains: regular RCA reviews, updated maintenance procedures, operator training on feeder fundamentals, and quarterly trend reviews of downtime data. The goal of Phase 3 is not further dramatic reduction but preventing regression to old patterns.
| Roadmap phase | Timeline | Target improvement | Key actions |
|---|---|---|---|
| Phase 1: Quick wins | Weeks 1-4 | 30-40% downtime reduction | Refill schedule, thread locker, spring calendar |
| Phase 2: Process improvements | Weeks 5-12 | Additional 20-30% reduction | Lot qualification, level sensors, digital controller |
| Phase 3: Systematic reliability | Ongoing | Sustain gains, prevent regression | RCA reviews, training, trend analysis |
- Start with quick wins to build momentum and credibility before tackling harder problems
- Set measurable targets for each phase — "reduce feeder downtime by 50% in 12 weeks" is more effective than "improve reliability"
- Review progress weekly during Phase 1 and biweekly during Phase 2
- Assign ownership — every corrective action needs a responsible person and a due date
Frequently Asked Questions About Feeder Downtime Root Cause Analysis
How long should I collect downtime data before starting RCA?
Collect at least 4 weeks of data before attempting Pareto analysis or prioritizing corrective actions. Shorter periods can produce misleading patterns — a single bad part lot can dominate a 1-week sample, while a 4-week sample is more likely to represent the true distribution of causes. If your operation runs multiple shifts, ensure all shifts are logging events consistently, because different shifts may experience different downtime patterns.
Who should perform the root cause analysis?
The most effective RCA is performed by a small team that includes the operator who was present during the stoppage, a maintenance technician familiar with the feeder, and an engineer who can identify systemic causes. The operator provides firsthand observations, the technician provides mechanical insight, and the engineer connects the specific event to broader patterns. A single person doing RCA in isolation is more likely to miss important causal links.
Should I track micro-stops under 1 minute?
Yes, if they are frequent enough to affect production output. A feeder that stops for 30 seconds every 10 minutes loses 5% of available time. Over a 2-shift operation, that is nearly 50 minutes of lost production per day. Micro-stops are often not logged by operators because they are easy to clear, but they are a significant source of hidden availability loss. If manual logging is impractical for micro-stops, use PLC-based monitoring to capture them automatically.
How do I decide between fixing a problem and replacing the feeder?
Consider replacement when: the feeder is more than 10 years old and requires frequent repairs; cumulative repair costs over the past 12 months exceed 40% of a new feeder price; the feeder cannot meet current feed rate or orientation requirements even after repair; or spare parts are becoming difficult to source. A new feeder from a reputable manufacturer like Huben Automation, with modern digital controls and proper preventive maintenance, should deliver 95%+ availability. If your current feeder consistently falls below 90%, the economic case for replacement is strong.
Part variation keeps causing downtime. What can I do?
Part variation is one of the most common and frustrating root causes. The feeder was designed and tuned for parts within a specific tolerance range, and parts outside that range cause tooling failures. Solutions include: (1) working with the part supplier to tighten tolerances, which may increase part cost but reduces feeder downtime; (2) designing tooling with wider margins that accommodate the full tolerance range, which may reduce orientation yield for nominal parts; (3) implementing a part inspection step before loading into the feeder; or (4) using a flexible feeding system with vision guidance that adapts to part variation. The right choice depends on the cost of downtime versus the cost of each solution.
Conclusion
Feeder downtime is not a random, unavoidable cost of automated production. It is the result of specific, identifiable root causes that can be systematically addressed. The method is straightforward: categorize every stoppage, apply the 5 Whys to find root causes, use Pareto analysis to prioritize, collect data consistently, and build a phased improvement roadmap. The discipline required is not technical — it is organizational. Teams that commit to consistent data collection and structured RCA consistently achieve 50-70% reductions in feeder downtime within 12 weeks. If you need help analyzing your feeder downtime patterns or designing a reliability improvement program, contact Huben Automation — our engineers bring field experience from hundreds of feeding systems across diverse industries.
Ready to Automate Your Production?
Get a free consultation and detailed quote within 12 hours from our engineering team.